Semantic Tracing In Business Processes
I am biased about tracing. On the one hand, you definitely need to have insights in your running processes especially if things are going bad in terms of exceptions, timeouts or just wrong data. On the other hand, it is often a huge mess of tracing data. Probably, the information is in there but you just cannot find it.
TL; DR; I invented a way of grouping traces on a per-business-process base.
Most applications these days are web applications and an HTTP request always belongs to one customer. But my approach could be transferred to BizTalk Orchestrations or Workflows as well. So you have some kind of process which starts in believing of doing everything just fine. The process happily processes the data, talks to databases and maybe the file system and another service. After some time it finishes successfully. Every written trace line about this process would be a waste of time, storage and bandwidth. But sometimes Murphy is getting creative at producing error conditions. :-)
If you want to analyze this process to find the root cause of an error, you definitely wish at some point, you had more data. What was the content of the variable? What was the name of the temp file? How long did that call take? And there is the overhead to find the right traces belonging to exactly this process while there are many thousand others working concurrently.
So there is a tradeoff in terms of storage and bandwidth as well as usefulness between a written trace and an omitted trace.
Additionally there was the idea of being able to raise the trace level to warning or error and still getting all the needed information.
So my idea was to just break the tradeoff. The system should produce every trace which could ever be useful but later on it decides to write these traces to storage or just throw them away. I came up with a TracingBag and its interface is very small.
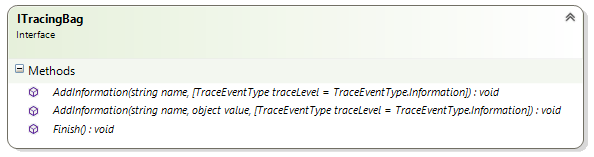
Using a TracingBag in code is easy. You create a new instance every time a new business process starts and you add every information about this process to this instance. This enables the separation of tracing data of different business processes. If you like, you can even put complete objects into the TracingBag. If you know the process is done, you call Finish() at the last action and that’s it.
So using the TracingBag does not really differ from any other logging strategy from the point of using it.
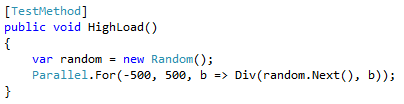
As an example, let’s consider a division calculation as a BusinessProcess. The code would look like this:
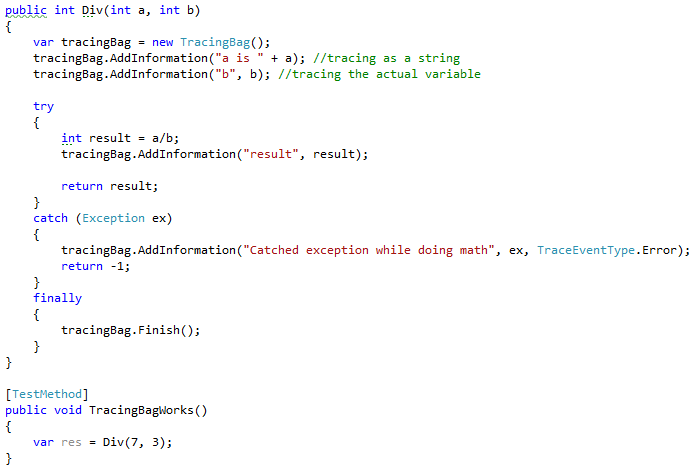
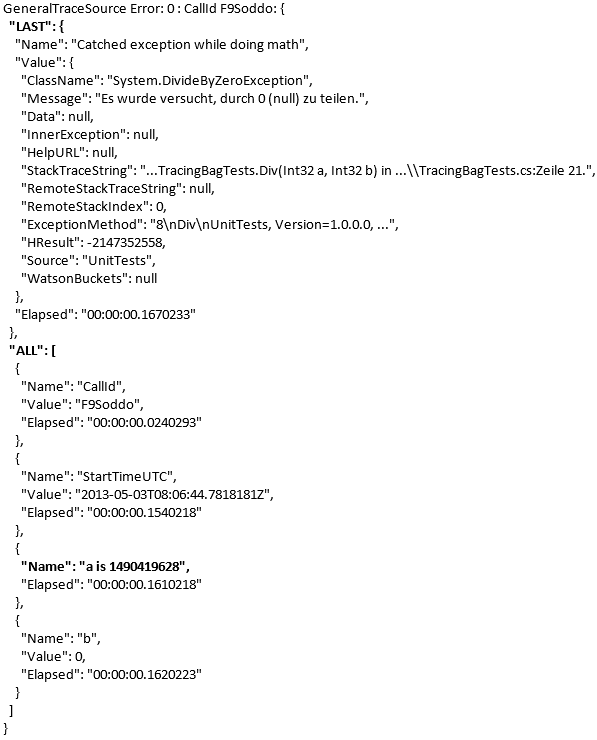
And the output from a single execution with trace level set to information looks like this:
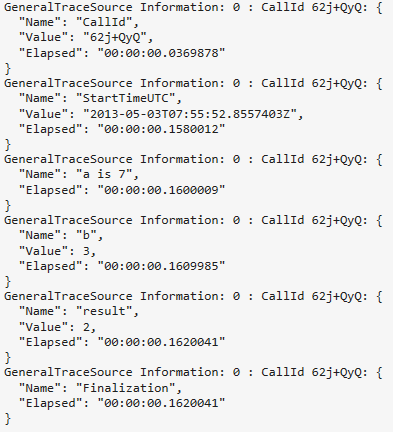
As you can see, a business process gets a random call id so you could filter between many traces based on this call id and you would find all traces belonging to this process. It also does timing traces on its own, so it helps you to find performance bottlenecks as well. If you traced a value, it gets json serialized.
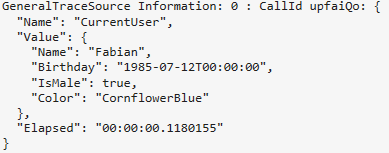
A better example of tracing values might be:

The corresponding trace looks like this:
Now back to many concurrent processes and the assumption of only a minor percentage that ever fails. In the case of our div sample, we know, we should never divide by zero but the sample actually does not test this. The following test simulates the concurrent load:
The Div method is called 999 times correctly and one time with the value of zero resulting in an Exception. The sample task could be to examine the traces to get to know the value of a. In case of the tracing above, you would find yourself searching through 1mb of data. This sounds still easy, but it could be GBs of data collected over days/weeks/months.
So let’s switch the trace level to warning and rerun the high load test. The complete trace of the high load sample is this:
And this is the real power of the TracingBag. It noticed the current trace level and decided to buffer all information traces belonging to the current business process and in the event of the warning trace, it appended all known data as well.
So the tracing bag reduces storage and bandwidth requirements in regards to tracing informations while also providing the ability to trace much more informations and helping you, understand your problems and hopefully solve them.
If you still following me, you might ask, why there is the Finish() method on the TracingBag. I’m glad you asked! :-) If you consider a business process which involves many concurrent tasks, it could happen that while one task writes a warning, another task could write information later. Serializing the trace events, it could look like this:
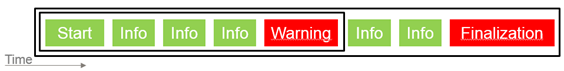
I had this case and I was interested in the last information data. The added Finish() method analyzes its own tracing bag and decides, whether there are unwritten information traces after a warning or error trace. If this is the case, the Finish() method outputs a summary of the complete tracing bag including all data using the highest tracing level used inside this TracingBag.